AI Insights
How the AI Insights panel on the Orders report turns your filtered data into a few ranked, actionable findings — and the guardrails that keep its numbers honest.
How the AI Insights panel on the Orders report turns your filtered data into a few ranked, actionable findings — and the guardrails that keep its numbers honest.
The AI Insights panel on the Orders report reads the data you’re currently looking at and writes a short, plain-language analysis of it. Instead of staring at a chart, you press Generate and get two or three findings that each say what’s happening, why, and what to do about it.
Open Reports → Orders, set your filters and date range, and look at the Analytics panel. AI Insights sits at the top; click Generate to produce the analysis for exactly the data on screen.
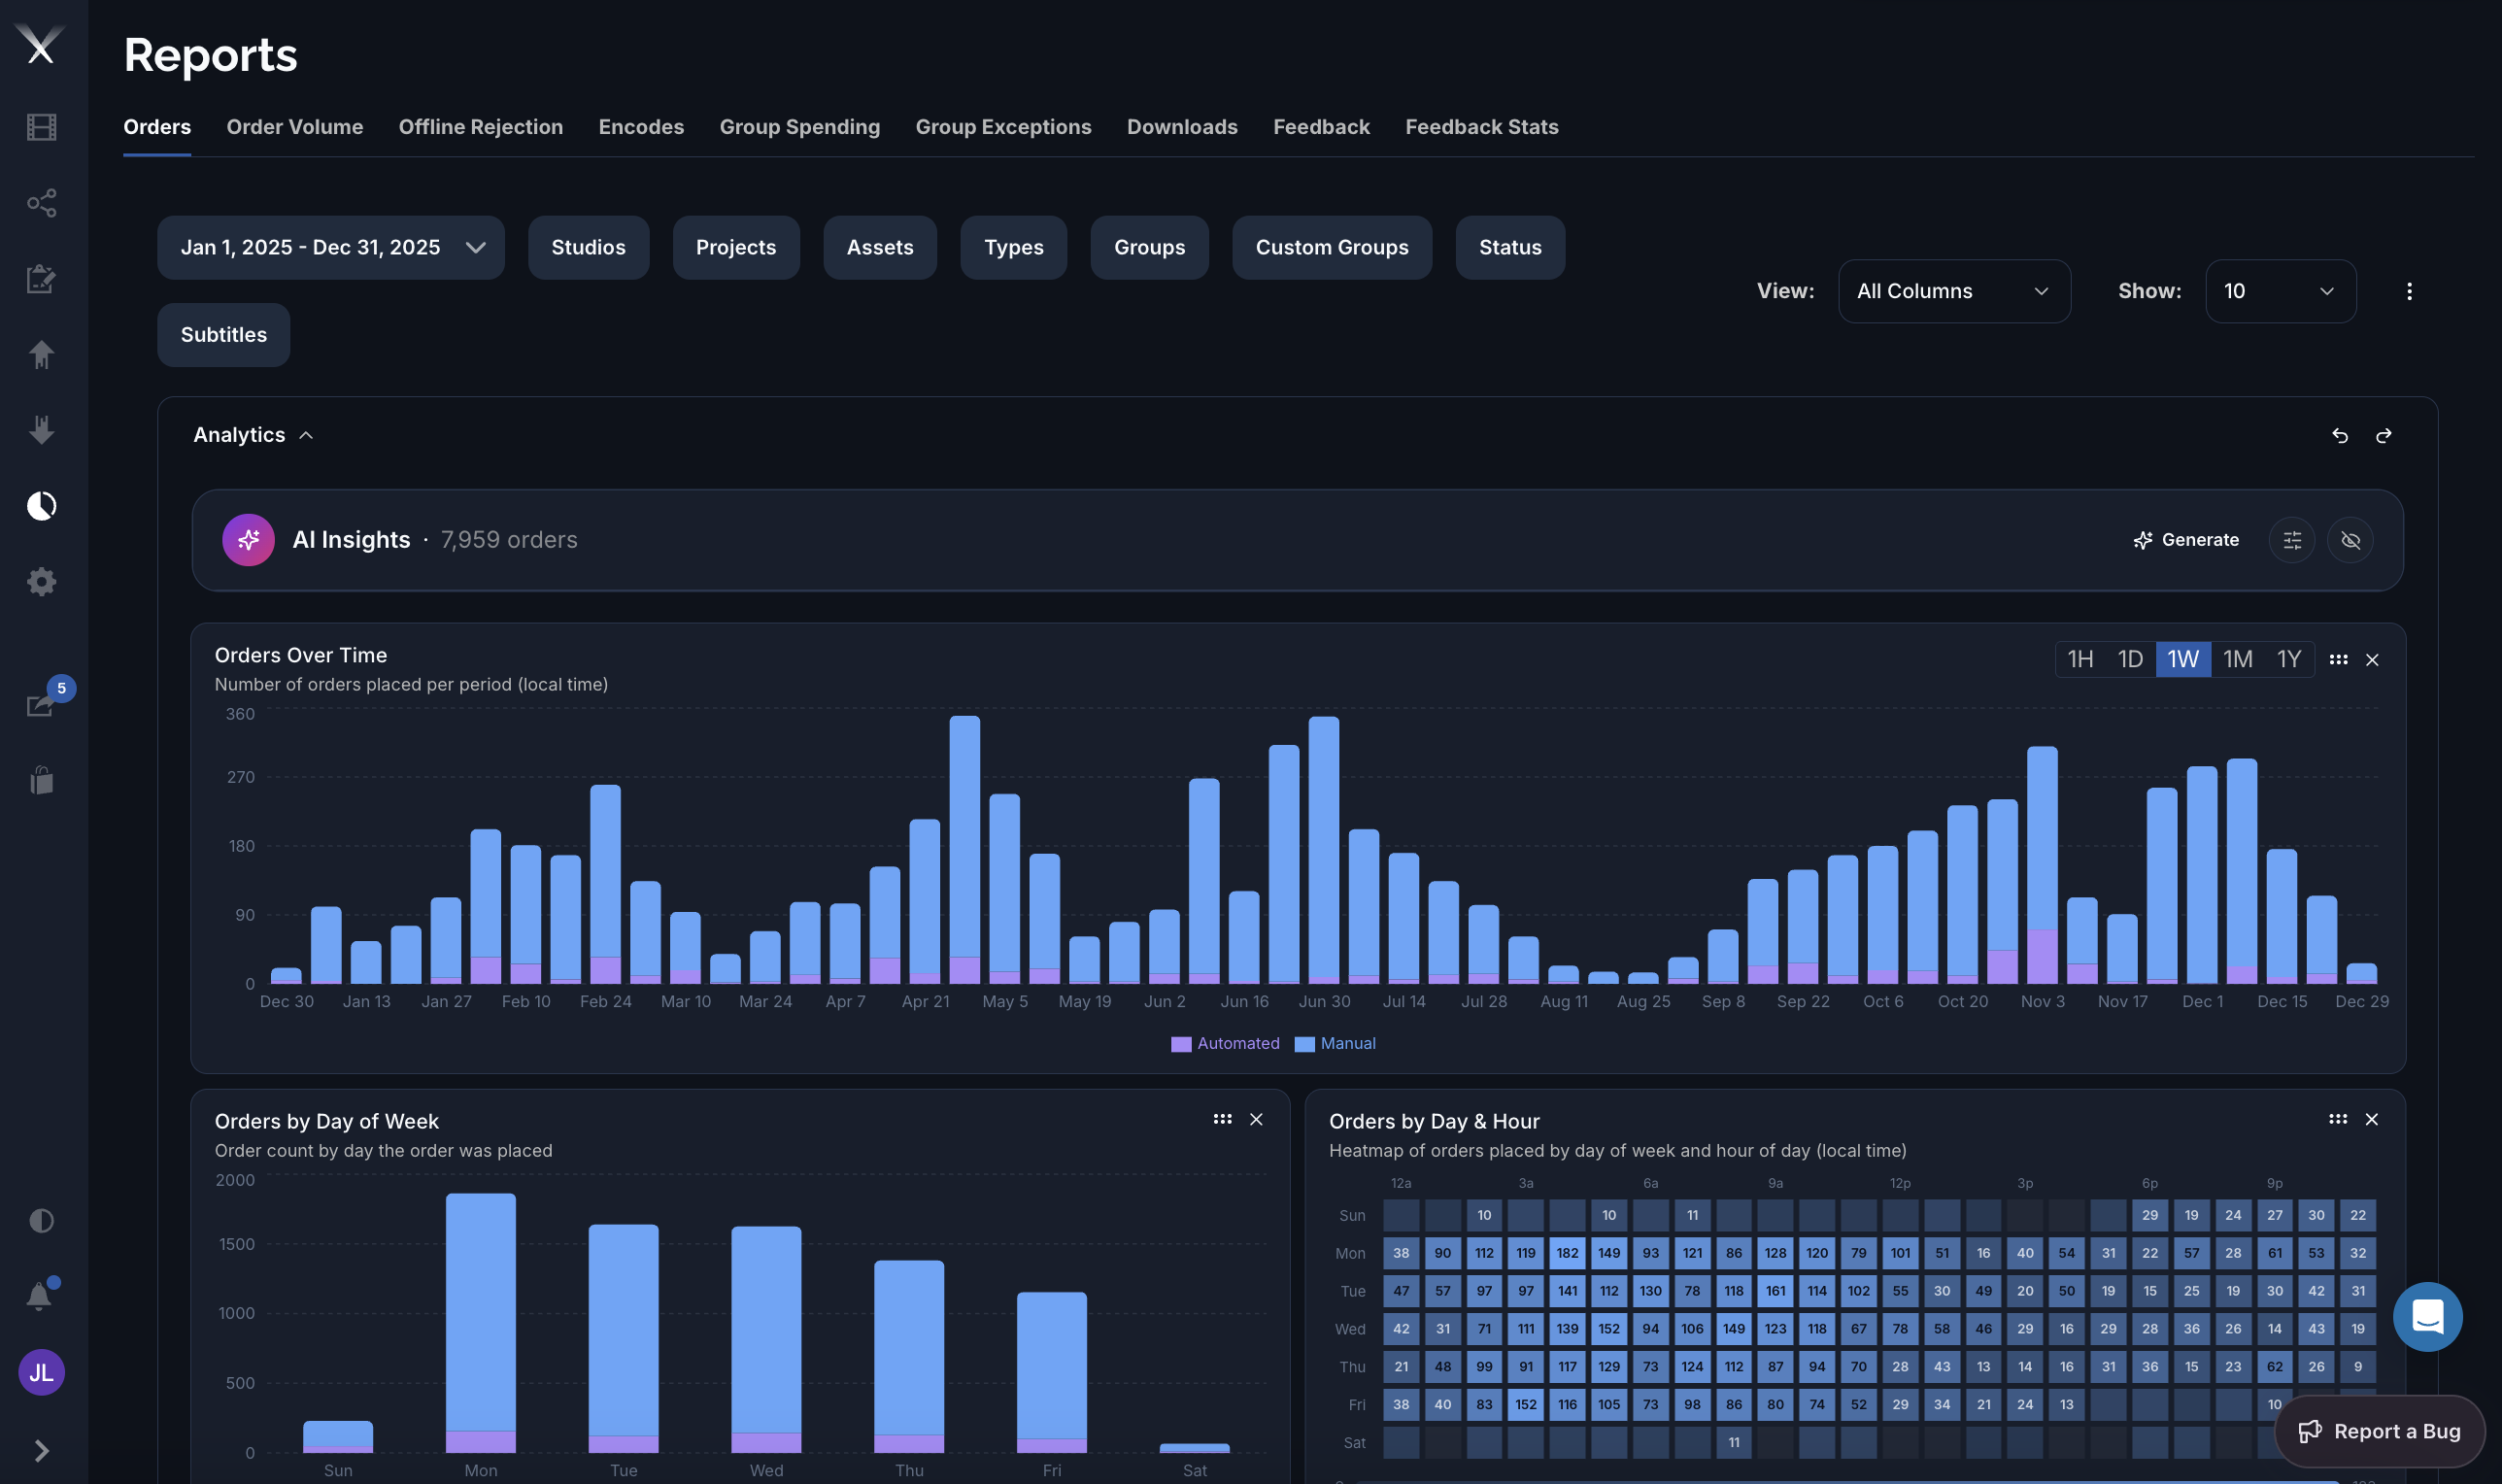
When you press Generate, Pixwel’s system analyzes a snapshot of the report you’re viewing and streams back the findings:
AI Insights works from the aggregated numbers in your report — the same figures the charts show. It isn’t given free rein over the database, and it can’t see data your account can’t.
Every insight follows the same shape:
The whole thing is oriented around the tensions you actually manage — cost vs. quality, speed vs. approval rigor, source readiness vs. demand, and automation vs. manual control.
Tell it who’s reading so it calibrates depth:
Save persistent directions (your priorities, vocabulary, preferred depth) and the agent applies them to every analysis — for example “always quantify in EUR” or “focus on vendor turnaround.”
Instead of the default summary, ask a specific question about the data on screen and it answers that.
The agent runs under strict rules designed to keep it honest: